

Seven months ago, NM Madness started doing something New Mexico’s legacy press refused to do: pulling raw federal datasets, mapping all 33 counties, and putting the unvarnished numbers right in front of the public. Week after week since March, we have published the county-by-county receipts on child poverty, Medicaid dependency, SNAP enrollment, alcohol mortality, and life expectancy.
This weekend, the Albuquerque Journal finally joined the conversation—and credit where it is due, they had the guts to put this together for the public.
The Journal just launched its New Mexico Data Scoreboard at datascoreboard.abqjournal.com, a permanently free, unpaywalled database comparing New Mexico against Arizona, Colorado, Oklahoma, Texas, and Utah across six categories. We genuinely applaud Journal ownership and management for building it, and we recommend every New Mexican bookmark it, share it, and—as always—verify the underlying sources for themselves.
Now comes the real test: let’s see if the Journal is actually willing to do what Managing Editor James Bennett and EVP Pepper Lang promised in their launch columns and "hold elected officials and other leaders accountable for the results".
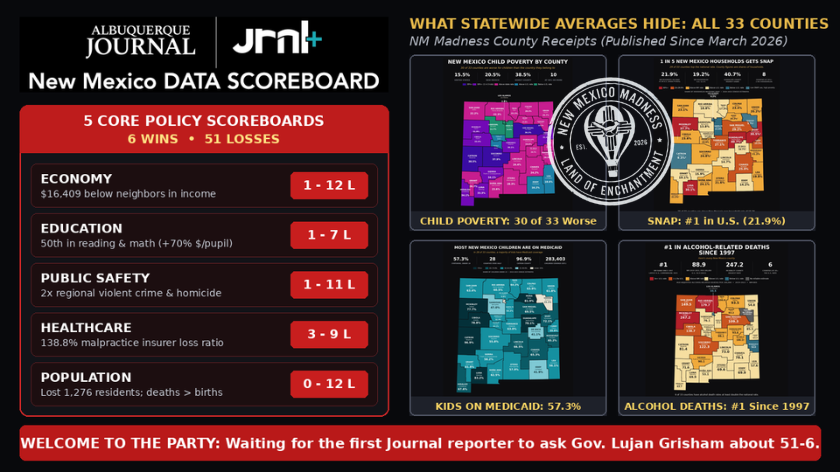
51 Losses Out of 57 Policy Metrics—Paging Gov. Lujan Grisham
The Journal scores only one category out of six as "Winning": Quality of Life (14–2). How did New Mexico earn that green banner? By padding the scorecard with non-policy participation trophies like Albuquerque’s 278 days of sunshine, a 2018 museum count, 2020 historic register plaques, and national park units.
Look at the five categories that actually reflect governance and policy outcomes:
- Economy: Losing 1–12.
- Education: Losing 1–7.
- Public Safety: Losing 1–11.
- Healthcare: Losing 3–9.
- Population: Losing 0–12.
Across those five core scoreboards, New Mexico loses 51 out of 57 scored measures against our neighbors and the nation.
Since the Journal says this tool exists to hold leaders accountable, we are waiting to see what their first real play is with this data leverage. We are waiting for the first Journal article where a reporter walks directly up to Gov. Michelle Lujan Grisham and asks a simple question: How do you view your eight years as the leader of this state when New Mexico’s #1 newspaper just documented that you are losing in 51 of 57 policy categories?
And while they are at it, they can ask the official New Mexico Democratic Party account—which spends every day pointing fingers at Washington and everywhere else—who they plan to blame for a 51–6 losing record when all five neighboring states operated under the exact same federal presidents.
A New Integrity Backboard for the Journal’s Own Reporters
Whether the Journal’s daily beat reporters realize it or not, their bosses just installed a permanent backboard of hard data at the top left of their own homepage.
Every story Journal reporters write from here on out has to clear that scoreboard before publishing—or the paper faces a glaring integrity issue. A reporter cannot publish a glowing, uncritical story stenographing a state agency press release about "historic economic growth" or "transformational education progress" on Page A1 when the paper’s own scoreboard one click away shows private-sector job growth is half the regional pace and New Mexico is 50th in reading and math. The receipts are now bolted to their own masthead.
Goodbye to the "Affordability Crisis" Spin
For the past two years, Democratic leaders in Santa Fe have leaned on an "affordability" agenda—handing out rebates and expanding government programs while blaming national price trends. The Journal’s scoreboard blows that narrative wide open.
Under Quality of Life, the Journal’s data shows New Mexico’s cost of living (92.21 Regional Price Parity) is 8% below the national average and cheaper than every single neighboring state. Our median home price ($279,900) is nearly $136,000 cheaper than the regional average ($416,220), and our home price-to-income ratio (4.13 years) is the lowest in the region.
New Mexico does not have a cost-of-living problem compared to its peers. It has a paycheck and dependency problem created by state policy:
- Household Income: A typical New Mexico household makes $67,816—roughly $16,400 a year less than the $84,225 regional average.
- Workforce Sidelines: Only 56.9% of working-age New Mexicans are in the labor force, trailing the regional average (63.68%) by nearly seven full points.
- Private-Sector Stagnation: Private-sector job growth (0.61%) is barely half the pace of neighboring states (1.12%).
- Demographic Freefall: New Mexico was the only state in the region to lose population last year (-1,276 residents), and it is the only state among the six where funerals outnumber baby showers (-0.89 net natural change per 1,000).
Source Audit: What the Journal Got Right—And the Healthcare Mirage
At NM Madness, we always check the primary sources. Our initial review confirms that the Journal pulled from legitimate, reliable federal and regulatory databases—Census, BLS, BEA, NCES, and CDC datasets that our readers will recognize because we have been mapping them since March.
On Education and Malpractice, the Journal’s methodology is refreshingly tough on state spin:
- Rejecting PED’s inflated numbers: On the Education tab, the Journal refused to score the Public Education Department’s internal state test (which claims 44% reading proficiency) or the state's self-reported 80.6% graduation rate. Instead, they used the federal NAEP exam—where New Mexico ranks 50th of 50 in 4th-grade reading (20.3%) and 8th-grade math (13.9%)—and placed it right next to the fact that New Mexico increased per-pupil spending by 70% in five years to $17,802 (highest in the region by nearly $5,000).
- Exposing the Malpractice Crisis: On Healthcare, the Journal used the Office of Superintendent of Insurance’s own actuarial numbers and NAIC regulatory filings to show New Mexico doctors pay double the regional average for malpractice coverage ($76,864 vs. $38,107, and $102,089 for OB/GYNs), driven by a 138.8% insurer loss ratio (2nd worst in America).
However, real questions remain on how the Journal built and scored certain categories—especially on the Healthcare tab.
In Section 3 of Healthcare ("Provider Supply"), the Journal gives New Mexico three "WINNING" grades—claiming the state beats the regional average in Primary Care Clinicians (296.9 per 100k), Primary Care MDs/DOs (168.3 per 100k), and Mental Health Providers (499.8 per 100k).
If you have waited six months to see a specialist while state legislative analysts warn New Mexico is short 5,000 healthcare workers across 32 of 33 counties, you already know those three "Wins" don't pass the smell test. Here is why:
- The "Ghost License" Flaw: The Journal pulled those numbers from the federal CMS NPPES registry and KFF license databases . As the Legislative Finance Committee and the New Mexico Medical Board have documented, NPPES and licensing rolls count everyone with an active New Mexico license or billing number—including doctors who moved to Texas or Arizona to escape malpractice rates, retired clinicians, out-of-state telehealth contractors, and federal VA/IHS doctors practicing in other states.
- The Journal's own page contradicts it: Look at Cards #1 through #4 on the Journal's exact same Healthcare page. Nearly 3 in 10 New Mexico adults don't have a personal doctor ("Losing"), ER wait times hit 163 minutes ("Losing"), ER walk-outs are double the regional rate ("Losing"), and 48.3% of New Mexicans live in a federal primary-care shortage area ("Losing"). Paper licenses don't treat patients.
What Statewide Averages Hide: The 33-County Reality
The other major limitation of the Journal’s scoreboard is that it stops at a single statewide number—allowing the government-funded bubbles of Los Alamos and Santa Fe to mask how deep the crisis runs across the rest of New Mexico.
When you pair the Journal’s statewide cards with the 33-county maps NM Madness has published from U.S. Census Bureau, USDA, and NMDOH data, the real divide comes into focus:
- Child Poverty: The Journal notes statewide child poverty is 20.5% (using 2024 Census SAIPE data) . Our county map of that exact dataset shows 30 of 33 counties are worse than the U.S. rate (15.5%), and 10 counties have at least 1 in 3 children in poverty—led by Catron (38.5%), Socorro (37.5%), and San Miguel (36.3%), while Los Alamos sits at 2.8% and Santa Fe at 14.8%.
- Overall Poverty: Across all ages, 30 of 33 counties are poorer than the nation (12.5%), and 11 counties are still at or above New Mexico’s worst-ever 2013 state peak of 21.9%—including McKinley (33.2%), Socorro (33.2%), Luna (28.6%), Cibola (28.4%), Quay (27.1%), Guadalupe (25.5%), and Chaves (24.3%).
- Medicaid Dependency: The Journal labels New Mexico’s 33.15% total Medicaid enrollment as neutral "Context—neither simply good nor bad". Our county map strips away the spin: 57.3% of all New Mexico children (283,403 kids) are on Medicaid, making up a majority of children in 28 of 33 counties (hitting 96.9% in Catron and 83.2% in Luna), because only 38.55% of residents have private insurance.
- Food Stamp Capital of America: The Journal left SNAP off its Economy board entirely. Federal USDA data shows New Mexico ranks #1 in the U.S. with 21.9% of residents on SNAP, and 29 of 33 counties top the national household rate (12.1%).
- The 19-Year Life Expectancy Gap: The Journal lists statewide life expectancy at 74.5 years . Our county map shows a child born in Los Alamos (83.0 years) or Santa Fe (79.3 years) lives up to 19 years longer than a child born in McKinley County (63.9 years) or Rio Arriba (69.3 years)—while New Mexico remains #1 in America in alcohol-related deaths since 1997 (88.9 per 100k, accounting for 1 in 5 working-age deaths).
Once again, hats off to the Albuquerque Journal for putting the scoreboard online for every citizen to see. Now the clock is ticking: let’s see if their newsroom uses that 51–6 record to hold the Governor and her party accountable—or if NM Madness has to do it for them.
Endnotes
Endnotes
- Albuquerque Journal, New Mexico Data Scoreboard (Launched October 2026; permanently public at datascoreboard.abqjournal.com). Accompanying launch columns: James Bennett, "Journal launches New Mexico Data Scoreboard to track state performance," October 24, 2026 ; Pepper Lang, "Here are the reasons behind Journal’s New Mexico Data Scoreboard," October 25, 2026.
- Economy Scoreboard (1 Winning, 12 Losing; Updated October 2026): Bureau of Labor Statistics (BLS), Preliminary June 2026 (unemployment rate 4.8%, labor force participation rate 56.90%, 12-month nonfarm job growth 0.65%, private-sector job growth 0.61%); U.S. Census Bureau, 2024 ACS 1-Year (median household income $67,816 vs. $84,225 regional average) and 2024 SAIPE (poverty rate); Bureau of Economic Analysis (BEA), 2025 Annual (per capita personal income $61,645; real GDP growth 1.52%); BLS QCEW, Q4 2025 Preliminary (average weekly wage $1,275); Tax Foundation, 2026 Edition.
- Education Scoreboard (1 Winning, 7 Losing; Updated October 2026): National Center for Education Statistics (NCES), 2024 NAEP (4th-grade reading proficiency 20.30%, 8th-grade math proficiency 13.9%, 4th-graders below Basic reading 53.10%); NCES FY2024 and FY2019–FY2024 (per-pupil public school spending $17,802 vs. $12,889 regional average; 70% spending growth over five years); AEI Return to Learn, SY2023–24 (chronic absenteeism 30.00%); NCES ACGR (77.0%) and AFGR (71.00%); National Institute for Early Education Research (NIEER), 2025 Yearbook (state-funded pre-K 53.0%).
- Public Safety Scoreboard (1 Winning, 11 Losing; Updated October 2026): FBI / Bureau of Justice Statistics (BJS), 2024 (violent crime rate 752.90 per 100k, homicide offenses 11.10 per 100k, aggravated assault 618.50 per 100k, property crime 2,940.20 per 100k, motor vehicle theft 538.10 per 100k); CDC / National Center for Health Statistics (NCHS), 2024 Provisional (homicide death rate 13.20 per 100k, firearm death rate 26.6 per 100k, drug overdose death rate 37.10 per 100k); HUD, January 2025 Point-in-Time Count (homelessness rate 22.00 per 10,000); NHTSA, 2024 (traffic fatality rate 19.20 per 100k; pedestrian fatality rate 4.22 per 100k, #1 highest in the U.S.).
- Healthcare Scoreboard (3 Winning, 9 Losing; Updated October 2026): CDC BRFSS, 2024 (adults with a personal doctor 70.95%); CMS Care Compare, 2024–2025 (median ER wait 163 minutes; ER walk-outs 3.0%); HRSA via KFF, Dec. 31, 2025 (48.3% of population in a primary-care shortage area); KFF / Census ACS, 2024 (private health insurance 38.55%, Medicaid coverage 33.15%); CDC / NCHS, 2022 (life expectancy at birth 74.5 years); America’s Health Rankings, 2023 (premature death 11,242 years of potential life lost per 100k); NM Office of Superintendent of Insurance (OSI) / Florida OIR NAIC Filings, 2024–2025 (average malpractice premium $76,864 vs. $38,107 regional average; independent OB/GYN premium $102,089 vs. $55,482 regional average; malpractice insurer loss ratio 138.8%).
- Healthcare Provider Supply Audit: While the Journal scores NM as "Winning" on provider counts using CMS National Plan and Provider Enumeration System (NPPES) and KFF/Redi-Data registries, legislative and regulatory analyses confirm licensing registries include out-of-state, retired, telehealth, and federal providers who do not treat patients clinically in New Mexico. See New Mexico Legislative Finance Committee (LFC), Hearing Brief: Physician Survey to Address Shortages, January 2026 (confirming 32 of 33 counties are designated health professional shortage areas and 65% of surveyed physicians are considering leaving NM) ; HRSA Maternal and Child Health Bureau / Legislative analyst estimates (confirming a statewide shortage of approximately 5,000 healthcare workers).
- Population Scoreboard (0 Winning, 12 Losing; Updated October 2026): U.S. Census Bureau Vintage 2025 Population Estimates (2020–2025 growth 0.33% vs. 6.04% regional average; July 2024–July 2025 population loss of -1,276 residents or -0.06%; net domestic migration rate -1.08 per 1,000; net natural change -0.89 per 1,000; working-age share 58.20%; seniors 21.10%); IRS Statistics of Income (SOI) Migration Data, 2022–2023 (-$93.1 million net adjusted gross income loss).
- Quality of Life Scoreboard (14 Winning, 2 Losing; Updated October 2026): BEA, 2024 Regional Price Parities (92.21 vs. 100.00 U.S.); U.S. Census Bureau, 2024 ACS 1-Year (median home value $279,900 vs. $416,220 regional average; home price-to-income ratio 4.13; average commute 24 minutes); EIA, 2024 (residential electricity price 14.20 cents/kWh); IMLS, 2018 Museum Data Files; National Park Service (NPS), FY2020 National Register of Historic Places and Sept. 2026 Unit List; NOAA / NCEI Comparative Climatic Data (278 sunny days in Albuquerque).
- NM Madness 33-County Map Sources: Child Poverty Map via U.S. Census Bureau, Small Area Income and Poverty Estimates (SAIPE), 2024 (released January 2026, ages 0–17; 90,276 children, 20.5% statewide); Overall Poverty Map via U.S. Census Bureau, ACS 2020–2024 5-year estimates, Table B17001 (17.8% statewide vs. 12.5% U.S.); Children on Medicaid Map via U.S. Census Bureau, ACS 2019–2023 5-year estimates, Table S2704 (57.3% statewide under age 19; 283,403 children); SNAP Households Map via U.S. Census Bureau, ACS 2020–2024 5-year estimates, Table S2201, and USDA Food and Nutrition Service FY2025 (21.9% of NM residents, #1 in U.S.; 19.2% of NM households); Alcohol-Related Deaths Map via New Mexico Department of Health (NMDOH), NM-IBIS 2019–2023 age-adjusted rates per 100,000 (88.9 vs. 50.9 U.S., #1 in the nation since 1997); Life Expectancy Map via County Health Rankings & Roadmaps 2025 (2020–2022 mortality data) and America’s Health Rankings 2025.


